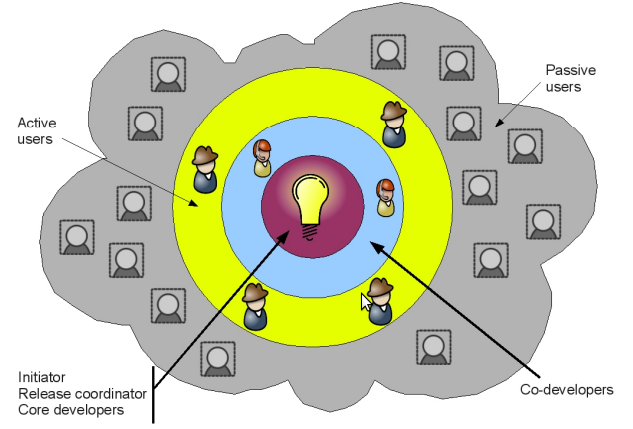
[ES] Casi todos los proyectos de software libre tienen una estructura común, que se la puede denominar estructura de modelo de cebolla. Esto es porque suele haber grupos de personas con diferentes grados de relevancia para el proyecto pero por niveles o capas, y se da de forma natural por la meritocracia con la que se manejan en las comunidades.
En esta entrada se trata de probar este modelo estudiando el comportamiento de los desarrolladores del proyecto brasero.
[EN] The idea of this post is to try to show that the FLOSS projects follow an onion model structure. This social structure in the FLOSS projects is due the meritocracy that takes place during the whole project lifetime.
So usually what happens in a project is that there are layers of group of people with different degrees of relevance, and this layers are normally distributed as the picture below shows us. Basically what we have is the core or main developers, then co-developers that usually make some commits when they feel like but they are not necessary indispensable for the project, and finally active and passive users. There could be always more layers, but this depends on the size of the project.
So in order to show you this we are going to study the repository of the brasero project, the commits, and finally prove that indeed there is always a small group of core people (main developers) that do a lot much more, in time and effort, followed by another layer of co-developers, followed by another layer of users and so.
First we use a cvsanalysed brasero repository (cvsanlysed means I used this cvsanaly tool on the repository) and once we have it on a db we are going to use R to play a bit with the statistic of the repo.
In R shell we do the following:
>con_brasero = dbConnect(MySQL(), user = “myuser”, password = “mypassword”, dbname = “fm3_brasero_cvsanaly2_svn_scm”)
this is to get the db connector
> rs_brasero = dbGetQuery(con_brasero, “SELECT count(*) as ncommits, committer_id, people.name FROM `scmlog`, `people`where scmlog.committer_id = people.id GROUP BY(committer_id) ORDER BY ncommits ASC;”)
and this is the query that gives us the number of commits alongside the committer id and username, and stores it on a resultset called rs_brasero
>tail(rs_brasero);
ncommits committer_id name
24 9 ituohela
31 7 kelemeng
68 5 dnylande
98 24 jorgegonz
196 15 lmedinas
1271 2 philippr
So here with the tail of the query, in which we get the number of commits per developer, we see that the core of the brasero development is form only by philippr (Philippe Rouquier), since he is the only one with 1271 commits. Let’s see this a bit more detailed with graphics, in order to understand it better.
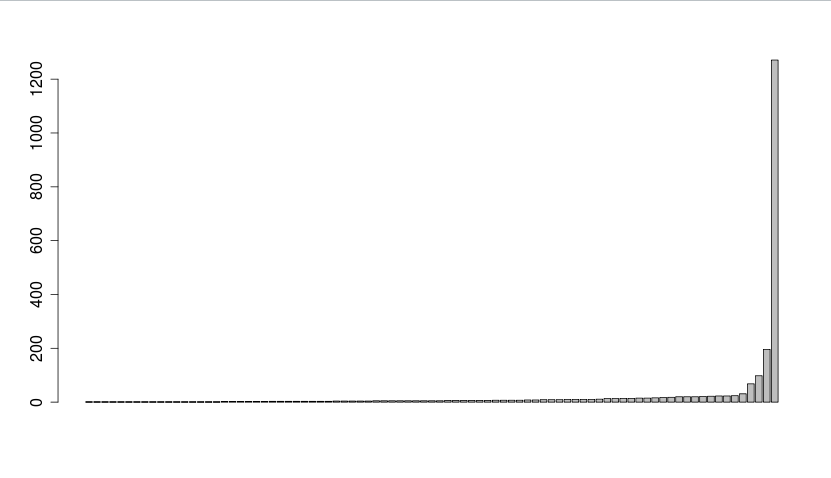
> barplot(rsbrasero$ncommits)
this plot show us the number of commits per committer
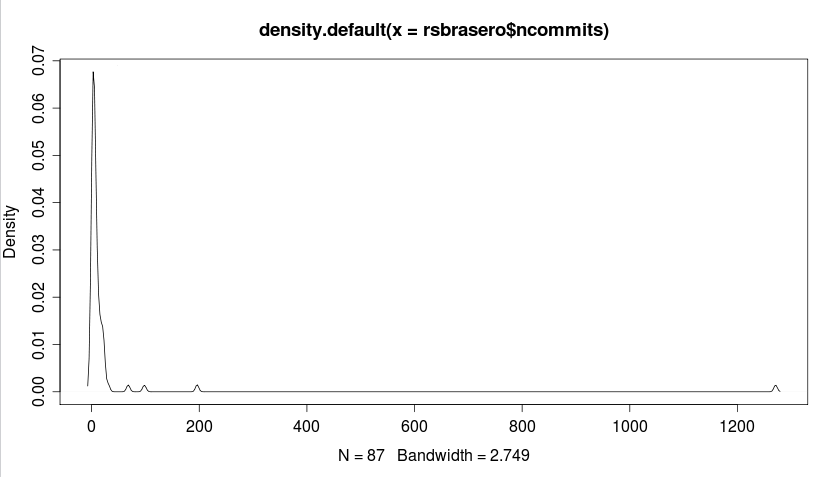
> plot(density(rsbrasero$ncommits))
this show as the population density, in this case the commits density
We can get to see the onion model more clearly just looking at the barplot of the commits where we have Philippe Rouquier (the guy with 1271 commits) as the first layer or core of the project as I said before. Then we can see that the second layer is formed by the following three persons, dnylande, lmedinas and jorgegonz, which have more or less that a hundred commits. And finally there is the rest of the onion that has less than forty commits.
This three groups or levels are even easier to see from the density plot, where we can get to see the first one on the little peak right the 1200 that represents the 1271 commits done by Philippe. Then the second group is formed by the next three little peaks between 0 and 200, and finally the last group which is the really big peak from the rest of people.
So here you have it, the three levels of the onion model from a brasero project study.


 es_ES
es_ES
Posted on November 16, 2011
0